Automation, secure firmware and robotics: a closer look at the work.
NXP / WORKING STUDENT · DEVELOPMENT OPERATIONS
From build to visibility.
I maintain and extend Jenkins build and test pipelines, automate environments with Ansible, and develop observability with Grafana and Prometheus. I also co-develop a PostgreSQL-backed engineering KPI platform.
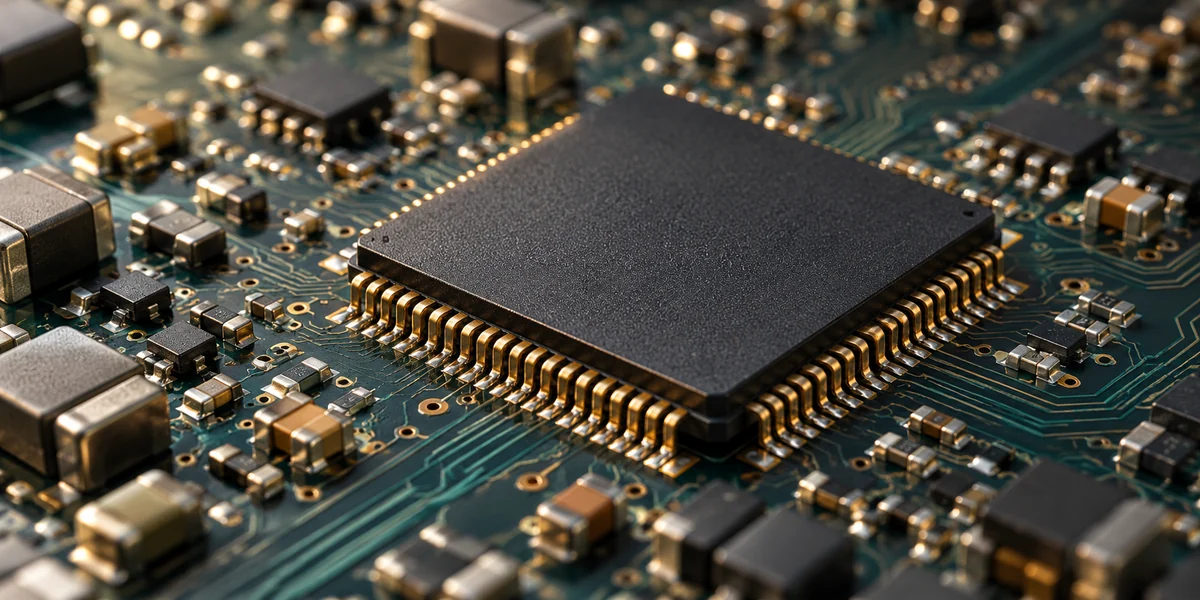
Implemented SPHINCS+ firmware-signature authentication and benchmarked SPHINCS+ and LMS on the NXP i.MX93. Built a Python / PySide6 application with SQLite for key handling and firmware signing.
SPHINCS+LMSi.MX93PythonPySide6
Oct 2024 – Jan 2025 · Bachelor thesis
SignVerifyUpdate
Illustrative artwork · Not a photograph of the thesis hardwareFirmware demoPlay the update · Compare three outcomes
RELATED BROWSER EXPERIMENT
From signature to safe boot.
Play a complete update, then compare tampering and recovery. Real ECDSA verification; modeled boot behavior.
Illustrative hardware. A and B represent logical firmware slots, not separate physical chips. Cryptography runs in your browser; boot and recovery are modeled.
Cryptographic checks pass. B fails the modeled health check; reset restores confirmed A.
Active
A
Confirmed
A
Sequence floor
7
Expected demo outcomes, not thesis benchmark results. Every run starts with A active and confirmed, and a sequence floor of 7.
Inspect the experiment: artifacts, assumptions & sources
What is computed?
SHA-256 and ECDSA P-256 signing/verification run locally through Web Crypto on a 4 KiB demonstration payload. Signing authenticates the data; it does not encrypt it. The private key is non-exportable. Each reset starts a fresh experiment; no files or keys are uploaded.
The issuer and device are logical roles inside one browser, not isolated hardware. A/B storage, trusted counters, reset and health confirmation are modeled. This is an educational protocol, not deployable firmware or an AHAB, MCUboot or SUIT implementation.
Where does i.MX93 differ?
NXP’s AHAB flow authenticates boot containers through its ROM/EdgeLock Enclave chain. SPL and DDR initialization precede later boot components. This generic update experiment does not emulate that hardware or its container format.
And post-quantum signatures?
This experiment uses classical ECDSA. SLH-DSA is the standardized hash-based scheme derived from SPHINCS+. LMS is stateful and requires careful signing-state management. Neither PQC scheme is executed here.
Run a scenario to inspect its generated public key fingerprint, manifest, signature and payload hashes.
02
ROBOTICS · MIT / MENOUFIA
Robots built to work together.
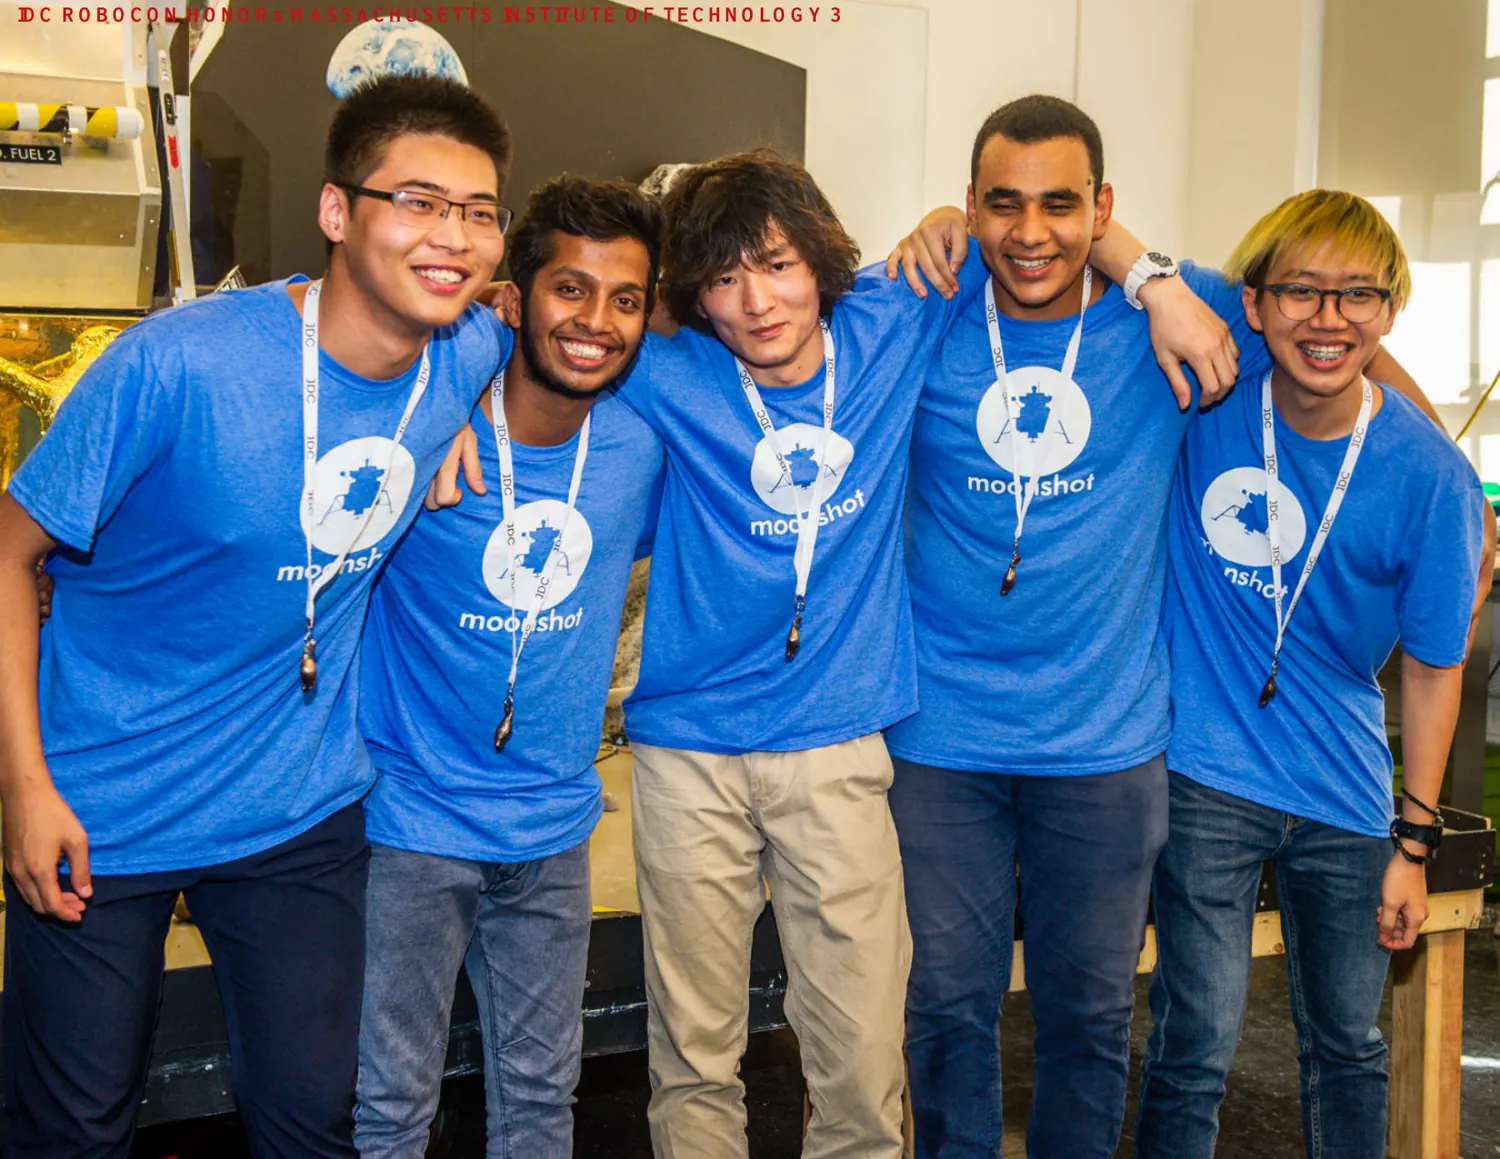
At MIT, I designed, programmed and tested autonomous robots for sample collection and communication. Our international team won first place at IDC ROBOCON.
EVENT
IDC ROBOCON
TEAM
International
RESULT
First place
I later led a student robotics team at Menoufia University, coordinating mechanical, electrical and software work.
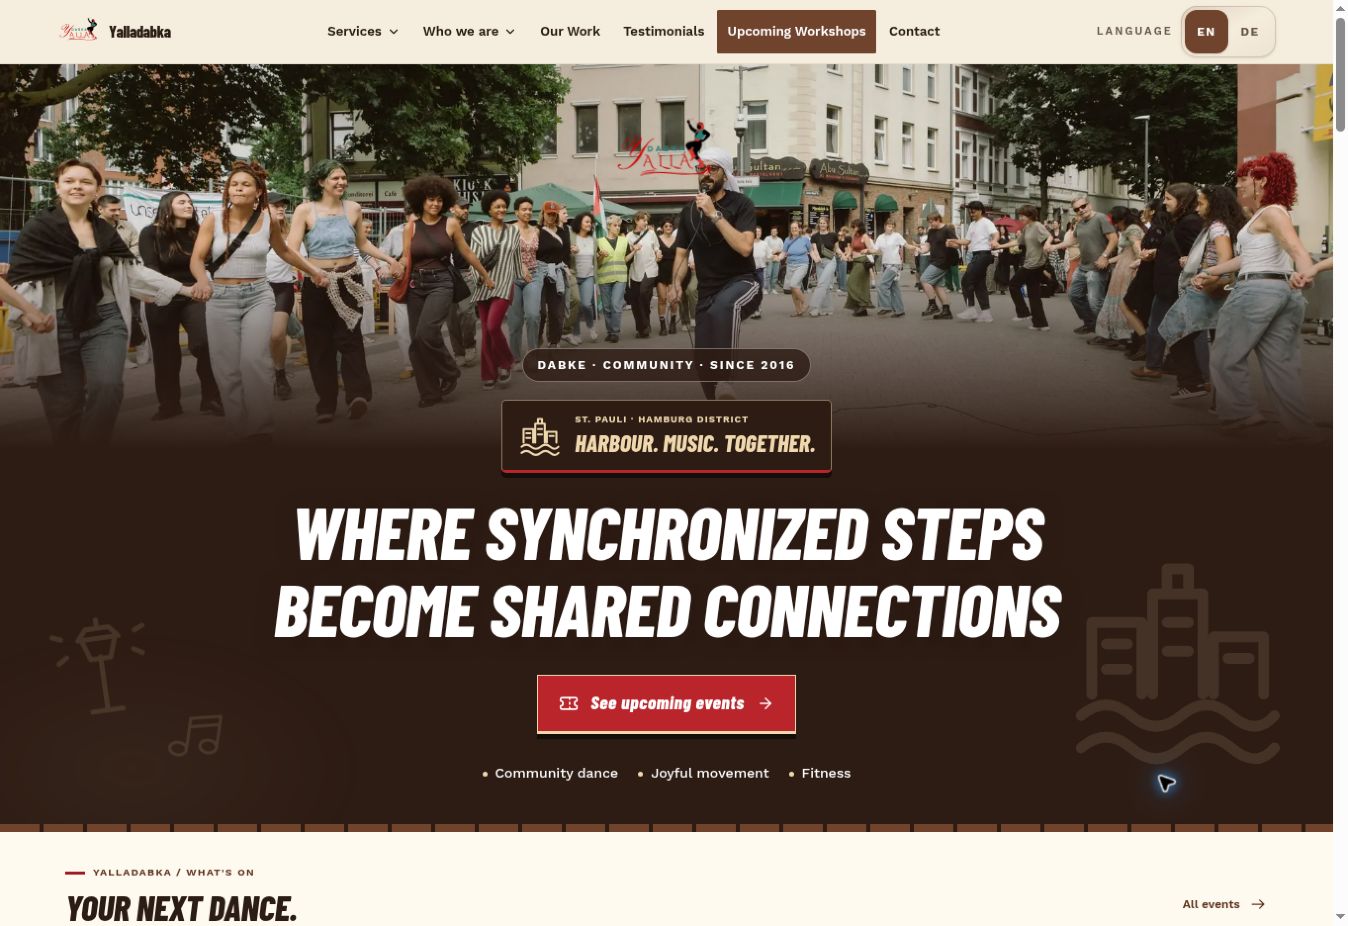
Keep a Hamburg community website deployable and support its day-to-day production operations.
My contribution
Help maintain delivery and operations: GitHub Actions, Docker / Compose and Nginx on an IONOS VPS, including health checks and security-header validation.
Explore the work
The live website and public repository show the application and its documented deployment workflow.
Connected containers combining sensor data, location tracking and embedded security.
Technical details
Smart containers using sensors, GPS and IoT nodes for real-time tracking. Explored secure storage, provisioning and key management in a distributed embedded environment using RIOT OS concepts.
IoTRIOT OSGPSSensors
2023 · University project
05
EMBEDDED COMMUNICATION · HAW
Bus systems & sensors.
Comparing embedded communication protocols and documenting the right fit for each system.
Technical details
Analyzed Ethernet, CAN, SPI, USB and RS485 for embedded systems. Compared protocol characteristics and documented communication requirements and selection criteria.
SELECTED SYSTEM01 / Code
Drag to orbit · select a system
Illustrative simulation · no live data
RELEASE PATH / SIMULATIONFrom change to confidence.Choose a scenario to begin
STAGES PASSED00 / 06CHANGE01
⌘
01 / SOURCE02 / DELIVERY
Speed
Run the simulation or step through it. Select any stage to inspect it.
STAGE INSPECTOR
Code
01 / 06
A change enters version control. A pipeline can start from a commit or pull request.
GitPull request
DELIVERY DECISIONWaiting for a run
RUN ACTIVITY
Pipeline journal
00Select a scenario and start a run.
Simulated events · no connection to NXP systems
POST-DEPLOY FEEDBACK
Observe the release.
Awaiting deployment
A synthetic health index illustrates how monitoring can inform a rollback. Values are examples, not actual measurements.
Health feedback appears after a deployment.
DEPLOYOBSERVEDECISION
No release has been deployed in this run.
↗
Select a scenario to see how delivery gates and feedback work together.
COMPARE THE OUTCOMES
Your recent runs.
Complete a run to compare outcomes. History stays in this page only.
Up to four simulated runs · select one to load its scenario again.
REAL-WORLD CONTEXT
At NXP, I work with Jenkins build and test automation, Ansible and observability tools. This lab is a simplified educational illustration, not an NXP pipeline or a representation of production data.
INTERACTIVE STUDY / 06Explore the connections.An illustrative engineering world connecting the disciplines behind the work. Choose an area to explore, or continue directly to the projects.+
Choose an area to explore the engineering world.Drag to rotate; use ± for zoom and field settings.
The interactive 3D view is unavailable or data saving is enabled. Use the project links below to keep exploring.
Explore the engineering
Guided navigation
FOLLOW THE ENGINEERING01 / 04
Choose a station or follow the path
EMBEDDED SYSTEMS · CURRENT STUDY
From electronics to embedded software, with FPGA and CNN concepts part of my current M.Sc. studies.
SignalsComputationSystems
About this visual
The bars show samples from the experiment: height is magnitude, teal is non-negative and amber is negative. A ring marks the selected sample. These are not device readings.
The 24 violet outer bars show relative FFT band peaks from 0–256 Hz in the selected frame. A light dot marks the strongest band. The data is synthetic.
The filter experiment is an illustration, not a trained network or FPGA implementation.
A procedural WebGL shader shapes the field on the GPU inside the existing 3D scene. Flow and contours are visual metaphors. In spectrum mode, eight sectors group the 24 calculated FFT bands; each shows its strongest band on a clipped dB display scale.
Camera view and zoom
VIEW CONTROLS
WORLD → WORK
Follow the thread.
Move from the visual model to the ideas and work behind it.
01 / HARDWARE & SIGNALS
From signals to systems.
Explore a mathematical signal, then see the FPGA and CNN topics in my current studies.
Enable JavaScript to explore this interactive calculation.
01 / INPUT
Tap pixels to draw. Use arrow keys to move and Space to toggle. The gold outline marks the selected filter window.
PATTERN TOOLS
Drag to fill cells. Turn this mode off to scroll over the grid or tap a cell to erase.
02 / FILTER3 × 3
÷ 1
03 / FEATURE MAP3 × 3
INPUT / 5 × 5OUTPUT / 3 × 3
Drag to rotate
Select an output value
Enable motion to play the scan.
PositiveNegative
A browser calculation inspired by CNNs: one 3 × 3 filter, stride 1, no padding. Height shows magnitude; color shows the sign. This is not an FPGA implementation or a trained neural network.
02 / SIGNALSSampling labChange a signal and see how sampling can mislead.+
INTERACTIVE ENGINEERING / 01
See what sampling misses.
Change a signal and its sampling rate. Watch how the same samples can suggest a different frequency.
The waterfall is unavailable, but the spectrum and numeric results remain available.
Motion is paused; use the frame slider.
Frames run top to bottom; brighter means a stronger FFT magnitude. Tap a frame or use the slider. Sweep varies the tone; one- and two-tone modes repeat the same frame. These are not recorded sensor data.
BUILD A SIGNAL
A single synthetic sine makes leakage easy to see.
Try both positions to see spectral leakage change.
The second sine has 55% of the first tone’s amplitude and the selected frequency separation.
ANALYSISCalculating…
Primary tone in this frame
—
Strongest displayed bin
—
Bin spacing
—
Peak level
—
What am I looking at?
A Hann window reduces spectral leakage, but widens peaks. Increase FFT size to reduce bin spacing. Peak level is relative to a unit-amplitude sine and is not a calibrated measurement.
Synthetic demonstration at 1,024 samples per second. The sweep is a sequence of independent stationary tones. It is not live telemetry, audio, a trained network, or an FPGA implementation.
The same frequency and phase are synthesized at 1,024 samples per second.
An ideal mathematical example, not live sensor data. The original is an ideal sine with adjustable phase; the displayed value is the folded frequency magnitude.
04 — ABOUT ME
Curious by nature. Practical by training.
I’m an Information Engineering graduate and Microelectronic Systems master’s student in Hamburg. My experience spans DevOps, embedded software, robotics, electronics and semiconductor security.
At NXP, I also work on the automation, build and observability systems that support secure software engineering.
ONGOING STUDIES
M.Sc. Microelectronic Systems
HAW Hamburg / FH Westküste
Enrolled since 2025
BACHELOR’S DEGREE
B.Sc. Information Engineering
HAW Hamburg · 2020 – 2025
PROFESSIONAL TRAINING
DevOpsCon Kubernetes CAMP
Hamburg · 2024
LANGUAGES
Arabic · Native English · C1 / Fluent German · A2 / Continuing to learn
05 — GET IN TOUCH
Let’s talk engineering.
Interested in DevOps, embedded software, hardware, robotics or secure systems? I’d be happy to talk.